Sea ice loss is predicted to occur in all climate models during the 21st century, with the greatest loss occurring in the fall (September-November) (Figure 1). Approximately 90% of models predict the Arctic will be ice free by 2100, and many models predict this could occur as soon as 2050 (IPCC, 2013).
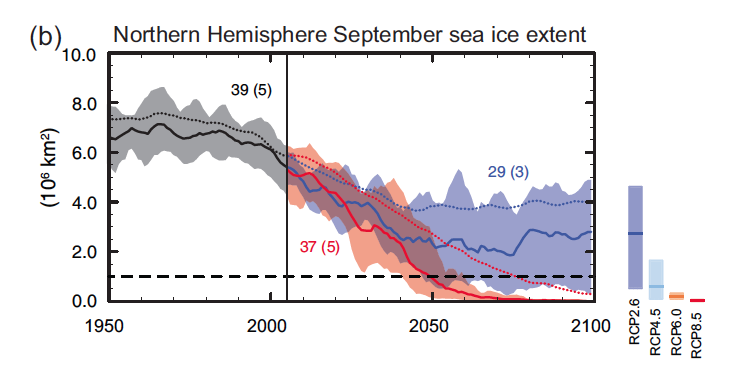
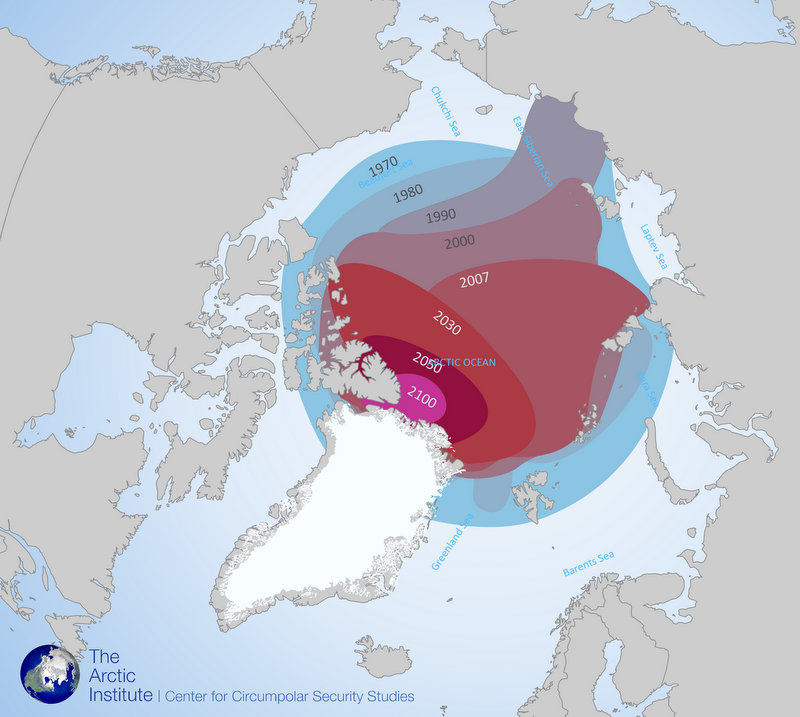
Figure 2 is a geographical representation of NASA’s observed and modeled annual sea ice extension lows, created by The Arctic Institute. This representation of the annual sea ice minimum was generated using NOAA’s GFDL Climate Model. It is predicted that the last sea ice zone will be located in the northern regions of the Canadian Arctic Archipelago and Greenland (The Arctic Institute, 2012).
Sea ice loss is also expected to occur around the continent of Antarctica (southern pole region) within the current century (Figure 3 & 4). This sea ice loss is predicted to be less acute than Arctic sea ice loss and occur with the highest severity in February, at the end of the Southern Hemisphere's melt season (IPCC, 2013).
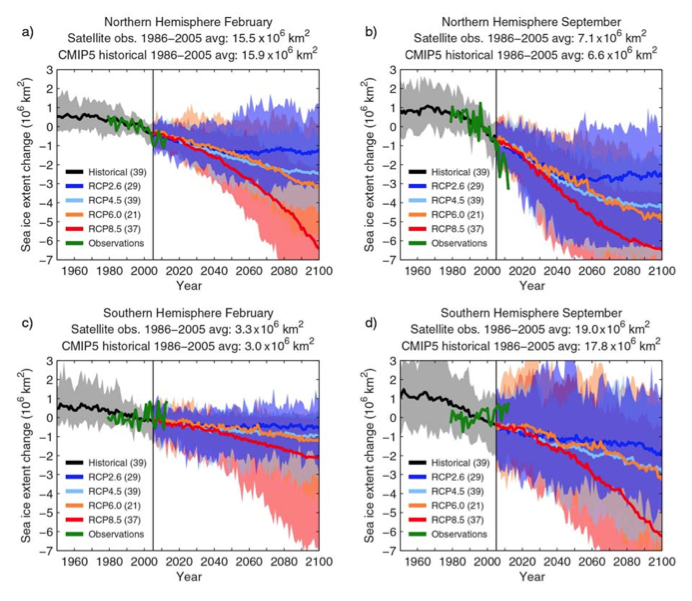
Figure 3: Predicted changes in sea ice extent in (a) Northern Hemisphere February, (b) Northern Hemisphere September, (c) Southern Hemisphere February (c) and (d) Southern Hemisphere September, using the ocean-atmosphere coupled model CMIP5 (IPCC, 2013).
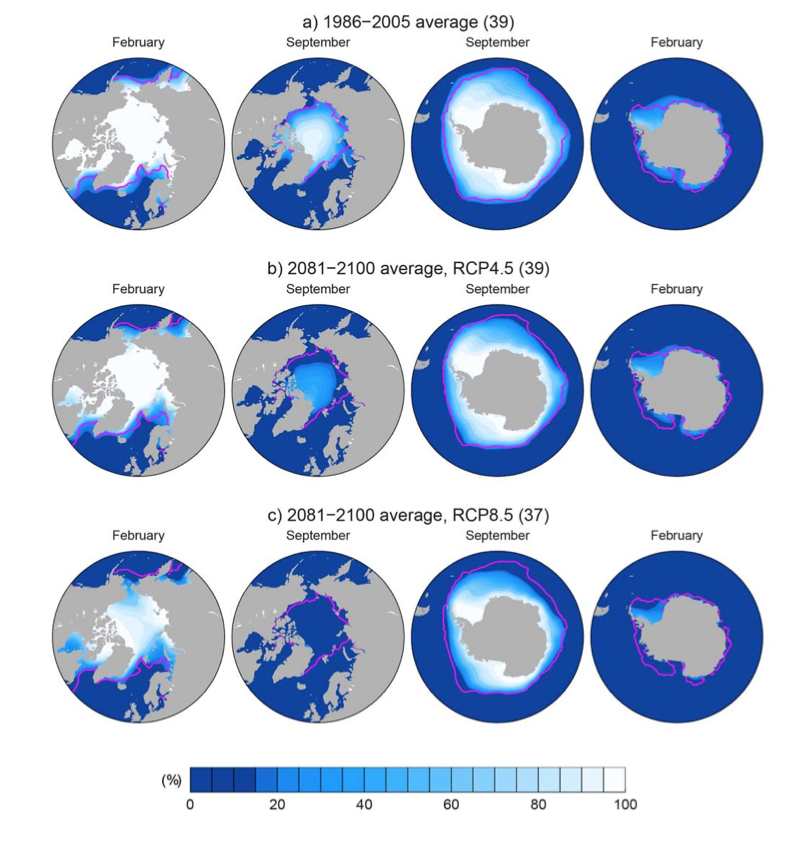
Figure 4: Predicted changes in sea ice concentrations from (a) 1986-2005 average, using two emissions scenarios: (b) RCP4.5 and (c) RCP8.5 for 2081-2100. Parentheses indicate number of models for each emission scenario, pink line indicates sea ice concentrations (>15%) during 1986-2005 average (IPCC, 2013).
Reference
Sea Ice Links
Material on this page was provided by Maren Pauly (Department of Geography, University of Waterloo)