Sea ice extent (“the sum of ice covered areas with concentrations of at least 15%” [IPCC, 2013]) since the late 1970s has shown a decreasing trend during all months of the year (Serreze et al., 2007). The decreasing trend is smallest during the winter and largest during the late summer and early autumn. In the recent years the loss of summer sea ice extent has accelerated.
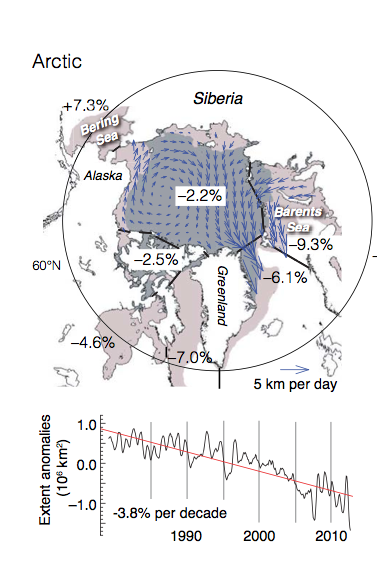
Figure 1: Current Patterns of sea ice drift
and extent across the Arctic (IPCC, 2013)
Since the advent of satellite monitoring of the Arctic, total sea ice extent has been declining (Figure 1) per decade by -2.3 ± 0.5% in winter (December-February), -1.8 ± 0.5% in spring (March-May), -6.1 ± 0.8% in summer (June-August) and -7.0 ± 1.5% in fall (September-November). Multi-year ice coverage has reduced by -12.5 ± 2.1% per decade since 1981, and sea ice drift speed an increased by 17 ± 4.5% per decade in winter and 8.5 ± 2.0% per decade in summer. Additionally, melt season period has increased by 5.7 ± 0.9 days per decade in the last 30 years. These changes are not homogeneous across the Arctic: sea ice extent in the Bering Sea has increased by 7.3% while extent in the Gulf of St. Lawrence has decreased by 13.8%. These geographical variations are due to the complex influence of climate change on the Arctic Oscillation (IPCC, 2013).
The C-Core Floe Edge Monitoring Service provides near-realtime and historical remote sensed satellite imagery of ice floes across Canada to assist in navigation for local communities. For more information, and to access sea ice imagery, visit the C-Core webpage. C-Core has also partnered with Newfoundland & Labrador Tourism to produce the Iceberg Finder. This service provides realtime iceberg maps and twitter alerts. Visit IcebergFinder.com for more information.
Current Arctic Sea Ice Extent
The following animation map depicts the last 10 days of ice cover in the Canadian Arctic. This daily ice extent data is generated using a collection of satellite, aircraft and boat observations. (Environment and Climate Change Canada, 2013)
Figure 2: The latest regional ice charts can be found on Environment and Climate Change Canada’s Ice Products Guide.
Plotting up to date Arctic sea ice extent data in comparison with the 30-year historical trend.

Figure 3: Compare the current sea ice extent to previous years using NSIDC's Interactive Sea Ice Graph.
Sea Ice Concentration


Figures 4 & 5: Sea ice concentrations are calculated daily, in near real time, through an algorithm using remote sensing measurements of microwave emission and scattering from the surface of the Earth. The service is a collaboration between the Arctic Regional Ocean Observing System (Arctic ROOS) and Polar View, a dynamic web interface which also displays sea ice charts and satellite imagery (next-day images available for download).
Larger Map
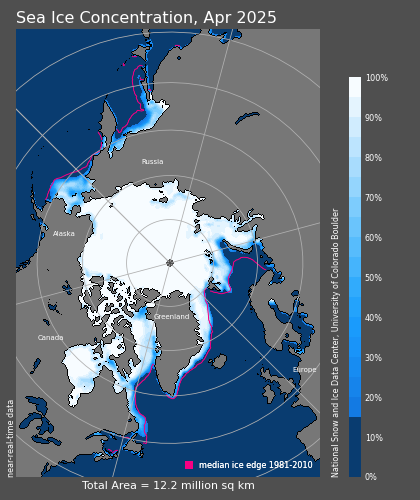
Figure 6: Current ice concentration expressed as a percentage, from 0% ice in open ocean, to 100% thick ice cover. This data is obtained using a Special Microwave Imager (NSIDC, 2013)
Larger Map
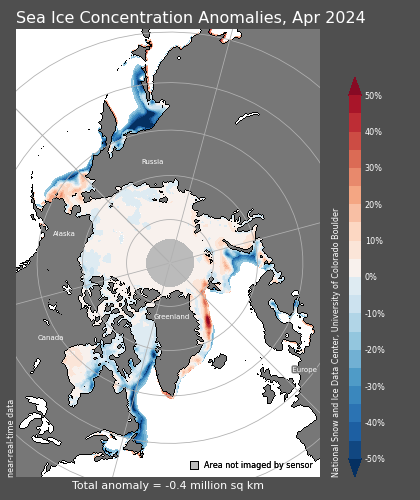
Figure 7: Current ice anomalies expressed as a percentage of divergence from a 1979-2000 mean. Ice conditions lower than average are in blue shades, and those higher than average are in red. This data is obtained using a Scanning Multichannel Microwave Radiometer (NSIDC, 2013)
Material on this page was provided by Dr. John Yackel (Department of Geography, University of Calgary), Maren Pauly (Department of Geography, University of Waterloo) and edited by Garret Reid (Department of Geography, University of Waterloo).