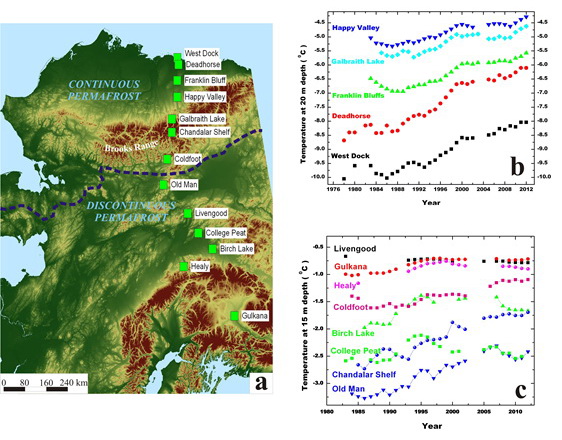
Permafrost temperature states are generally colder further north, as permafrost progresses from discontinuous to continuous. Additionally, according to borehole monitoring sites, permafrost temperatures have generally increased across Canada, Alaska and Siberia over the last half-century. A study (Shiklomanov et al., 2012) has shown that Alaskan permafrost temperatures across the continuous-discontinuous boundary has increased within the last few decades (Figure 1).
Melting rates have been shown to vary across permafrost types and locations. Permafrost that forms at colder temperatures has a lower threshold for change than those that form at higher temperatures. This means that a modification from cold permafrost to warm permafrost will continue to occur. This trend will lead to a more continuous permafrost type across the Arctic.
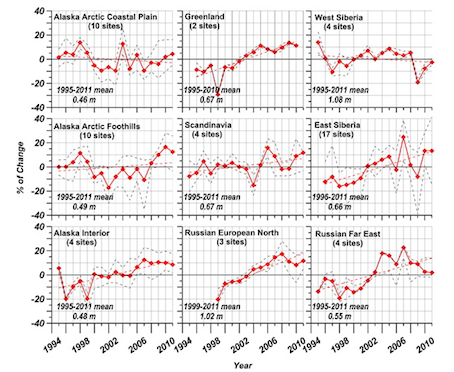
The active layer thickness (the surface ground layer that melts and freezes seasonally) variation over the last 15 years fluctuates differently across the Arctic (Figure 2). A general, yet inconsistant increase in active layer thickness has been found at most sites, indicating a warming climate. However, some sites (Alaska Coastal Plain & West Siberia) have seen a decrease in active layer thickness (Romanovsky et al., 2012).


Recent Permafrost Trends (IPY)
North America
| Region | Permafrost Temperature during IPY (°C) | Permafrost Temperature Change (°C) | Depth (m) | Period of Record | Source |
|---|---|---|---|---|---|
| Northern Alaska | -5.0- to -10.0 | 0.6-2.7 | 10-20 | early 1980s to 2009 | Osterkamp, 2007; Smith et al., 2010; Romanovsky et al., 2010 |
| Mackenzie Delta and Beaufort coastal region | -0.5 to -8.0 | 1.0-2.0 | 12-20 | late 1960s to 2009 | Burn & Kokelj, 2009; Burn & Zhang, 2009; Smith et al., 2010 |
| Canadian High Arctic | -11.8 to -14.3 | 1.2-1.7 | 12-15 | 1978 to 2008 | Smith et al., 2010; Smith et al., 2012 |
| Interior Alaska | 0.0 to -5.0 | 0.0-0.8 | 15-20 | 1985 to 2009 | Osterkamp, 2008; Smith et al., 2010; Romanovsky et al., 2010 |
| Central and Southern Mackenzie Valley | >-2.2 | 0.0-0.5 | 10-12 | 11984 to 2008 | Smith et al., 2010 |
| Northern Quebec | >-5.6 | 0.0-1.8 | 12-20 | 1993 to 2008 | Allard et al., 1995; Smith et al., 2010 |
Europe
| Region | Permafrost Temperature during IPY (°C) | Permafrost Temperature Change (°C) | Depth (m) | Period of Record | Source |
|---|---|---|---|---|---|
| European Alps | >-3 | 0.0-0.4 | 15-20 | 1990s to 2010 | Haeberli et al., 2010; Noetzli and Vonder Muehll, 2010; Christiansen et al., 2012 |
| Russian European North | -0.1 to -4.1 | 0.3-2.0 | 8-22 | 1971 to 2010 | Malkova, 2008; Oberman, 2008; Romanovsky et al., 2010; Oberman, 2012 |
| Nordic Countries | -0.1 to -5.6 | 0.0-1.0 | 2-15 | 1999 to 2009 | Christiansen et al., 2010; Isaksen et al., 2011 |
Northern and Central Asia
| Region | Permafrost Temperature during IPY (°C) | Permafrost Temperature Change (°C) | Depth (m) | Period of Record | Source |
|---|---|---|---|---|---|
| Northern Yakuita | -4.3 to -10.8 | 0.5-1.5 | 14-25 | early 1950s to 2009 | Romanovsky et al., 2010 |
| Trans-Baykal region | -4.7 to -5.1 | 0.5-0.8 | 19-20 | late 1980s to 2009 | Romanovsky et al., 2010 |
| Qinghai-Xizand Plateau | -0.2 to -3.4 | 0.2-0.7 | 6 | 1996 to 2010 | Cheng & Wu, 2007; Li et al., 2008; Wu & Zhang, 2008 |
| Tian Shan | -0.4 to -1.1 | 0.3-0.9 | 10-25 | 1974 to 2009 | Marchenko et al., 2007; Zhao et al., 2010 |
| Mongolia | 0.0 to <-2.0 | 0.2-0.6 | 10-15 | 1970 to 2009 | Sharkuu et al., 2007; Zhao et al., 2010; Ishikawa et al., 2012 |
Antarctica & Greenland
| Region | Permafrost Temperature during IPY (°C) | Permafrost Temperature Change (°C) | Depth (m) | Period of Record | Source |
|---|---|---|---|---|---|
| Maritime Antarctica | -0.5 to -3.1 | N/A | 20-25 | 2007 to 2009 | Vieira et al., 2010 |
| Continental Antarctica | -13.9 to -3.1 | N/A | 20-30 | 2005 to 2008 | Vieira et al., 2010; Guglielmin et al., 2011 |
| East Greenland | -8.1 | N/A | 3.25 | 2008 to 2009 | Christiansen et al., 2010 |
References
Permafrost Links
Material on this page was provided by Maren Pauly, Department of Geography, University of Waterloo.
