Thermal Model
Scientists at the Geological Survey of Canada have used site specific one-dimensional thermal modelling to determine the impact of climate warming on thaw depth and permafrost thickness at selected sites in the Mackenzie Valley. The results for Norman Wells and Fort Simpson are shown in Figure 1. Thaw depths are plotted as a function of time for three scenarios: a linear air temperature increase, an exponential air temperature increase, and a linear increase with 10% more snowfall. The plots show the increase in maximum annual thaw depth over the 50-year simulation period and the rise in the base of permafrost. In all simulations, the rate of change in thaw depth is very slow in the first 10 to 20 years but significantly greater thereafter. These results suggest that detection of the early impacts of warming by monitoring thaw depth may be difficult, particularly when allowing for seasonal variations and when dealing with permafrost temperatures near 0°C.
Geographic Information System Model
The GSC is also developing a GIS based modelling and mapping techniques which integrate key environmental factors for predicting the occurrence of permafrost. These are being validated for the Mackenzie Valley and are being applied to the regional prediction of equilibrium permafrost distribution temperature and thickness under various climate warming scenarios (Figure 2).
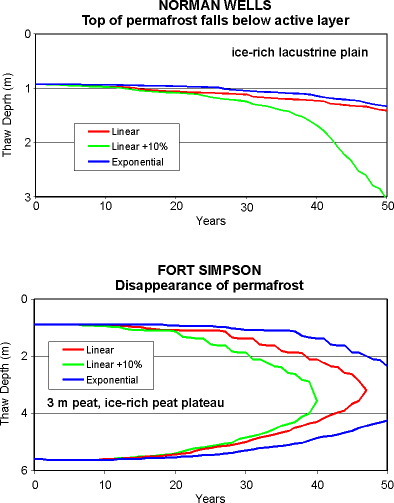
Figure 1: Predicted increase in thaw depth and permafrost degradation for two sites in the Mackenzie Valley under three climate warming scenarios (Image courtesy GSC).
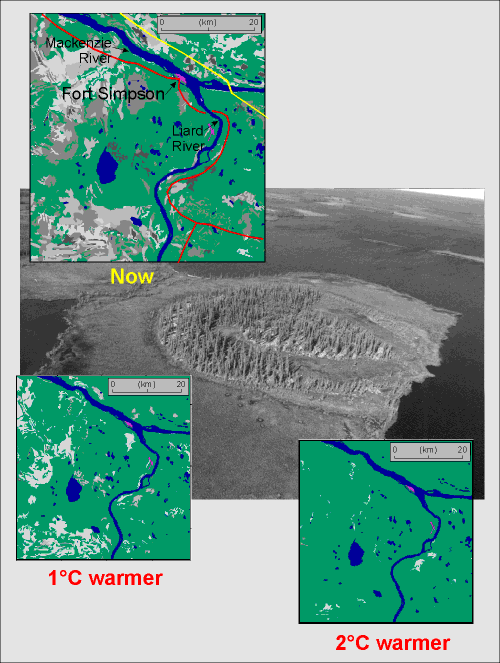
Figure 2: Predicted permafrost occurrence in the Fort Simpson study area under a 1°C and 2°C increase in mean annual air temperature, and current climate conditions (mean annual air temperature of -4°C). Blue indicates rivers or lakes, green corresponds to unfrozen material, and white indicates permafrost thicknesses between 1 and 5 m, light grey between 5 and 10 m, and dark grey between 10 and 15 m. The Norman Wells pipeline is shown in yellow and Mackenzie Highway in red (Wright et al., 2000). (Image courtesy GSC).
A model calculating the Temperature at the Top Of Permafrost (TTOP) has also been developed by Smith and Riseborough (1996). Because snow cover and ground thermal properties significantly modulate the relation between air temperature and permafrost, this model links permafrost with the surface climatology through seasonal surface transfer functions and subsurface thermal properties. The model is exact for equilibrium conditions, and provides a reasonably accurate estimate of subsurface temperatures under transient conditions. Results of the TTOP model indicate that Canadian permafrost will become largely confined to the northern portions of the mainland Territories and the Arctic Islands if there is a doubling of atmospheric carbon dioxide. Baffin Island will no longer have a complete cover of permafrost, and it will disappear completely in northern Quebec. According to the model, the total area of permafrost would be reduced eventually to less than half its current extent.
Material for this page was provided by Margo Burgess and Sharon Smith, Geological Survey of Canada.