Snow Anomaly Tracking
Environment and Climate Change Canada provides a snapshot of the current, daily snow conditions in the context of historical averages. Updated daily, this snow anomaly tracking displays a map of spatial snow depth anomalies and six time series of snow cover extent and snow water equivalence.
Current Snow Depth: Departure from Historical Mean
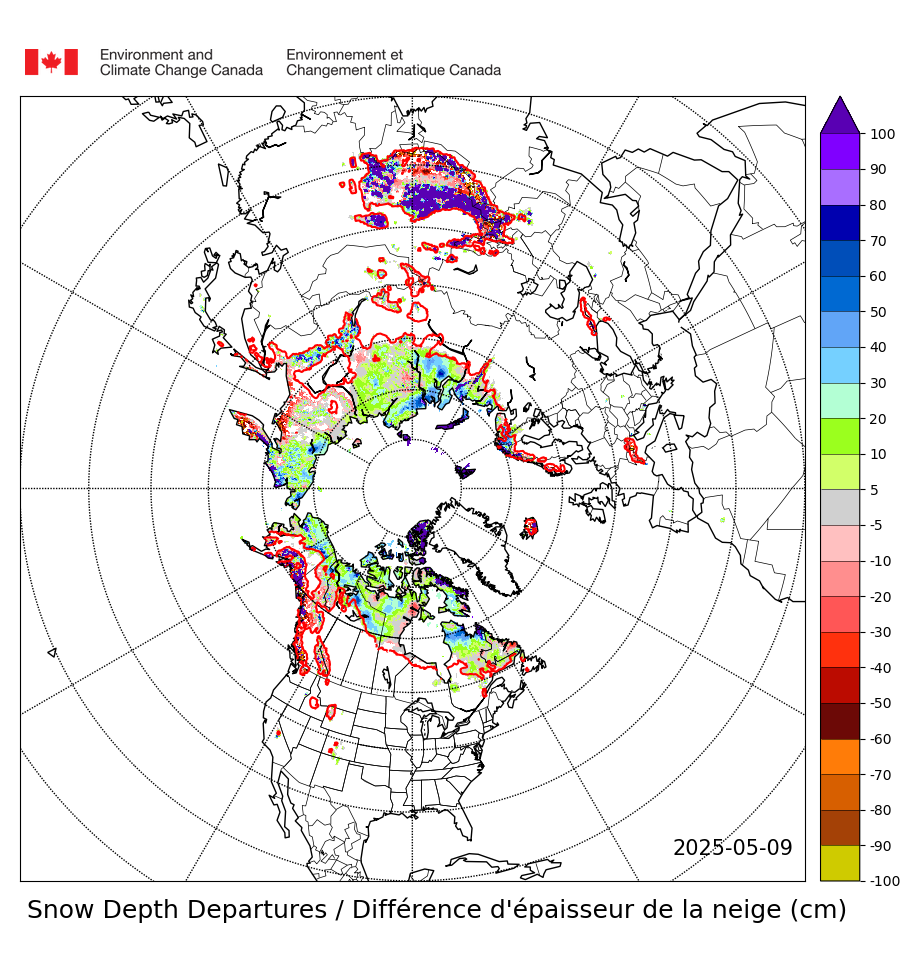
Data are derived from the operational global snow depth analysis run at the Canadian Meteorological Centre, Environment and Climate Change Canada Canada, since 1998. The CMC analysis is based on optimal interpolation of real-time climate station snow depth observations merged with background information from a simple snow model, as described in Brasnett (1999). This snapshot is a contribution to the Global Cryosphere Watch (GCW) programme of the World Meteorological Organization. (Brasnett, B. 1999. A global analysis of snow depth for numerical weather prediction, Journal of Applied Meteorology 38:726-740.)
Environnement Canada – Suivi des anomalies de neige (Français)
Figure 1, L’épaisseur de la neige actuelle – différence de la moyenne historique: Cette carte montre la différence (en cm) entre l’épaisseur de la neige quotidienne actuelle et l’épaisseur moyenne pour la période allant de 1998-1999 à 2011-2012. Les zones en gris sont celles où l’épaisseur de la neige actuelle est à moins de ±5 cm de la moyenne historique. La ligne de contour rouge en gras indique l’emplacement historique de la limite des neiges permanentes (probabilité de 50 % que l’épaisseur de la neige soit ≥ 2 cm).
Les données proviennent de l’analyse opérationnelle mondiale de l’épaisseur de la neige, qui est effectuée au Centre météorologique canadien depuis 1998. L’analyse du CMC est fondée sur l’interpolation optimale des observations de l’épaisseur de la neige faites en temps réel dans les stations climatologiques, ces observations étant fusionnées avec les données de base issues d’un modèle de neige simple, tel qu’il est décrit dans Brasnett (1999). Cet aperçu contribue au programme Veille mondiale de la cryosphère (VMC) de l’Organisation météorologique mondiale (OMM). (Brasnett, B. 1999. A global analysis of snow depth for numerical weather prediction, Journal of Applied Meteorology 38:726-740.)
| Snow Cover Extent | Snow Water Equivalent | |
|---|---|---|
| Northern Hemisphere | 2a 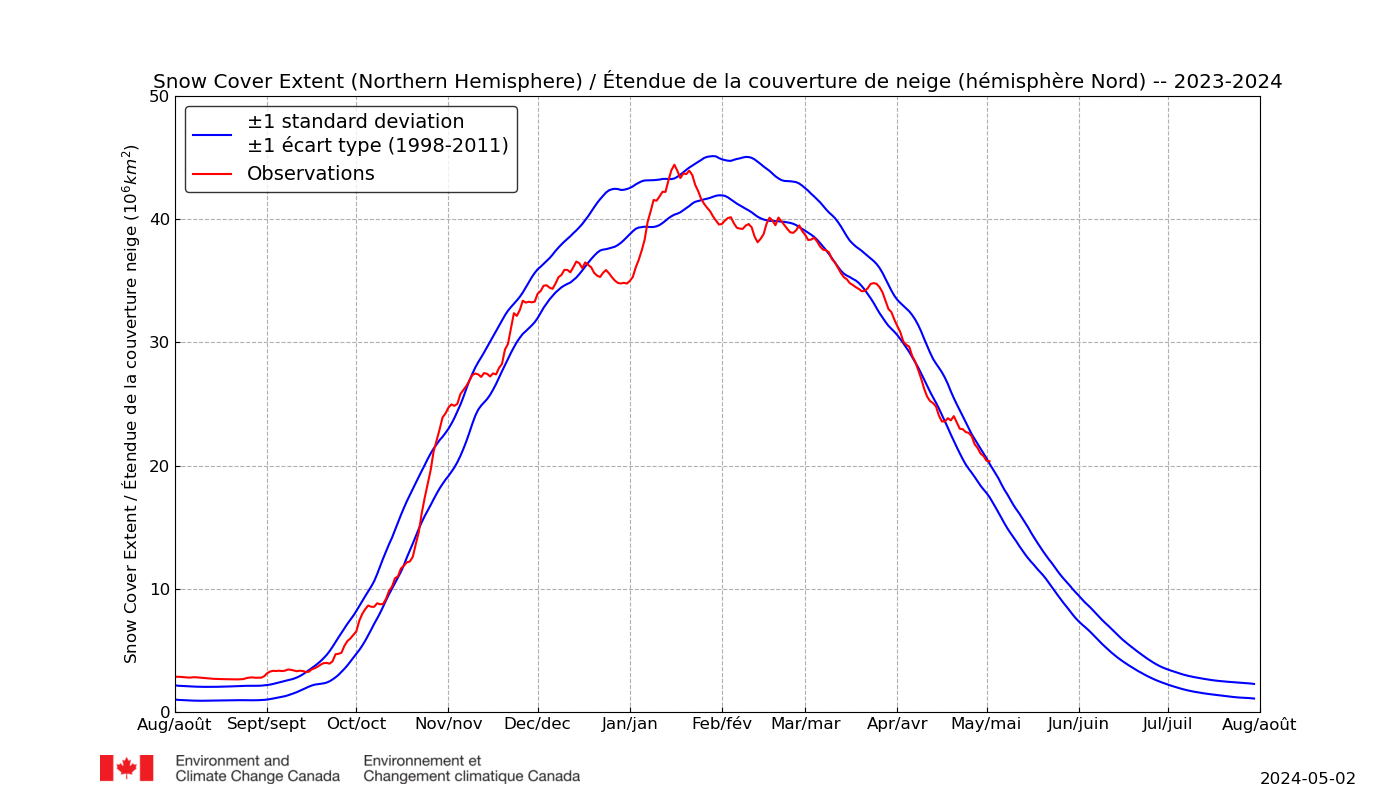 |
3a 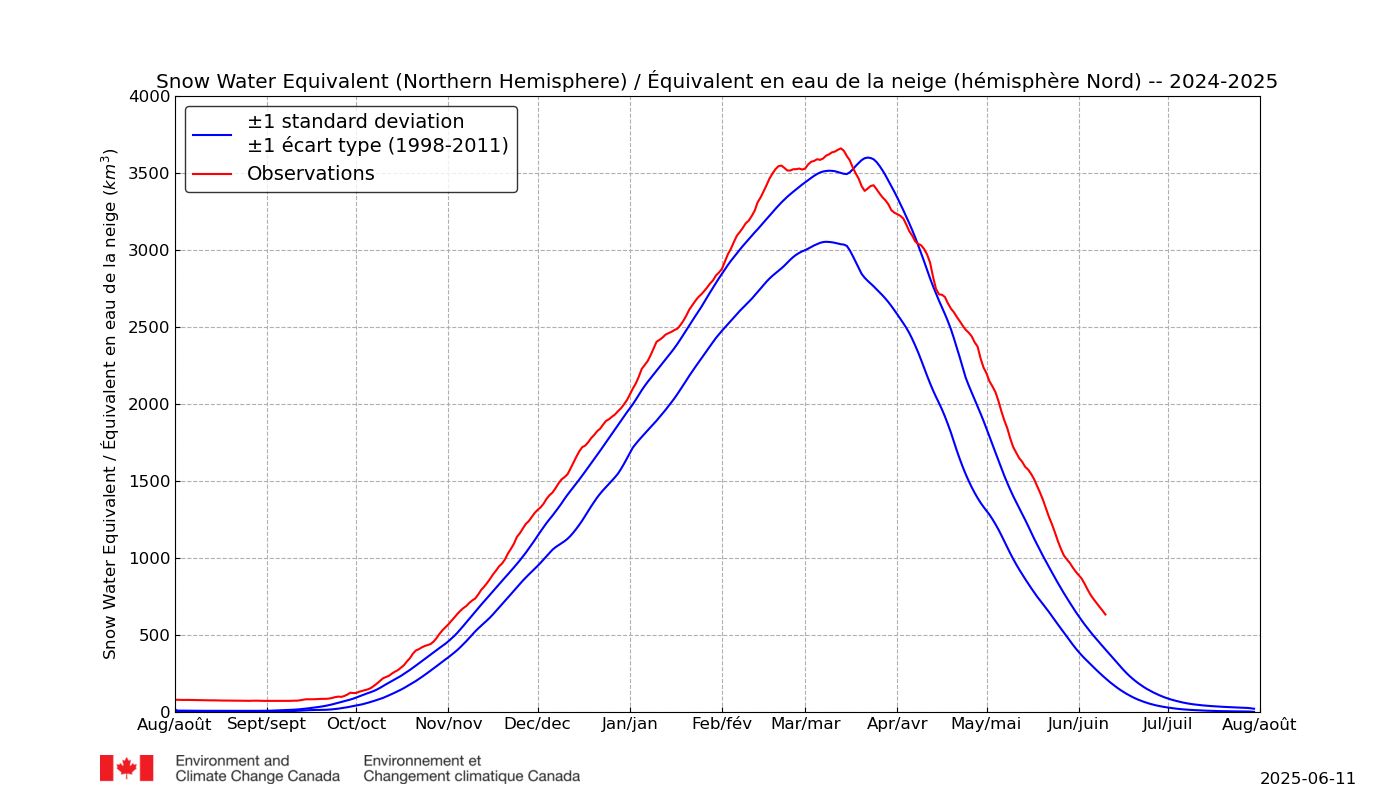 |
| North America | 2b 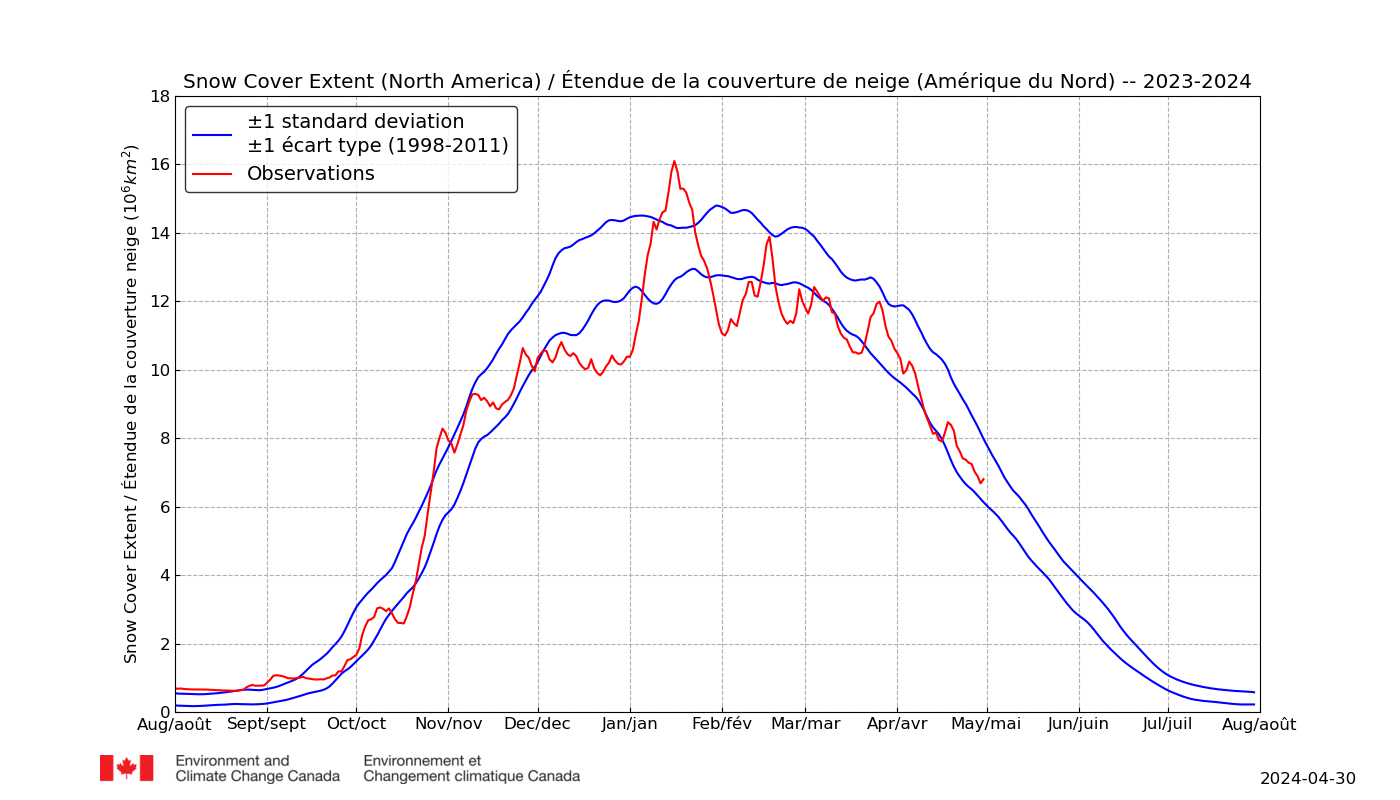 |
3b 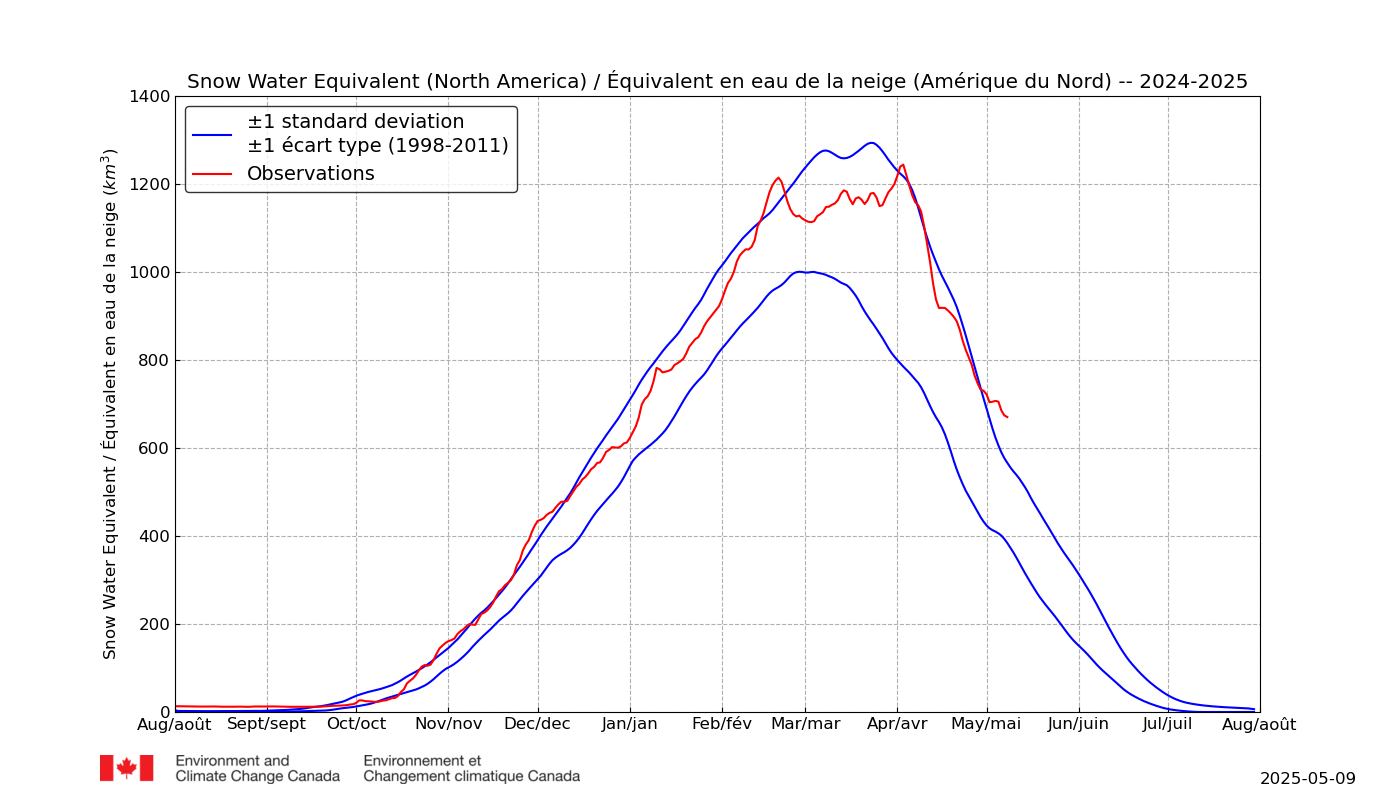 |
| Eurasia | 2c 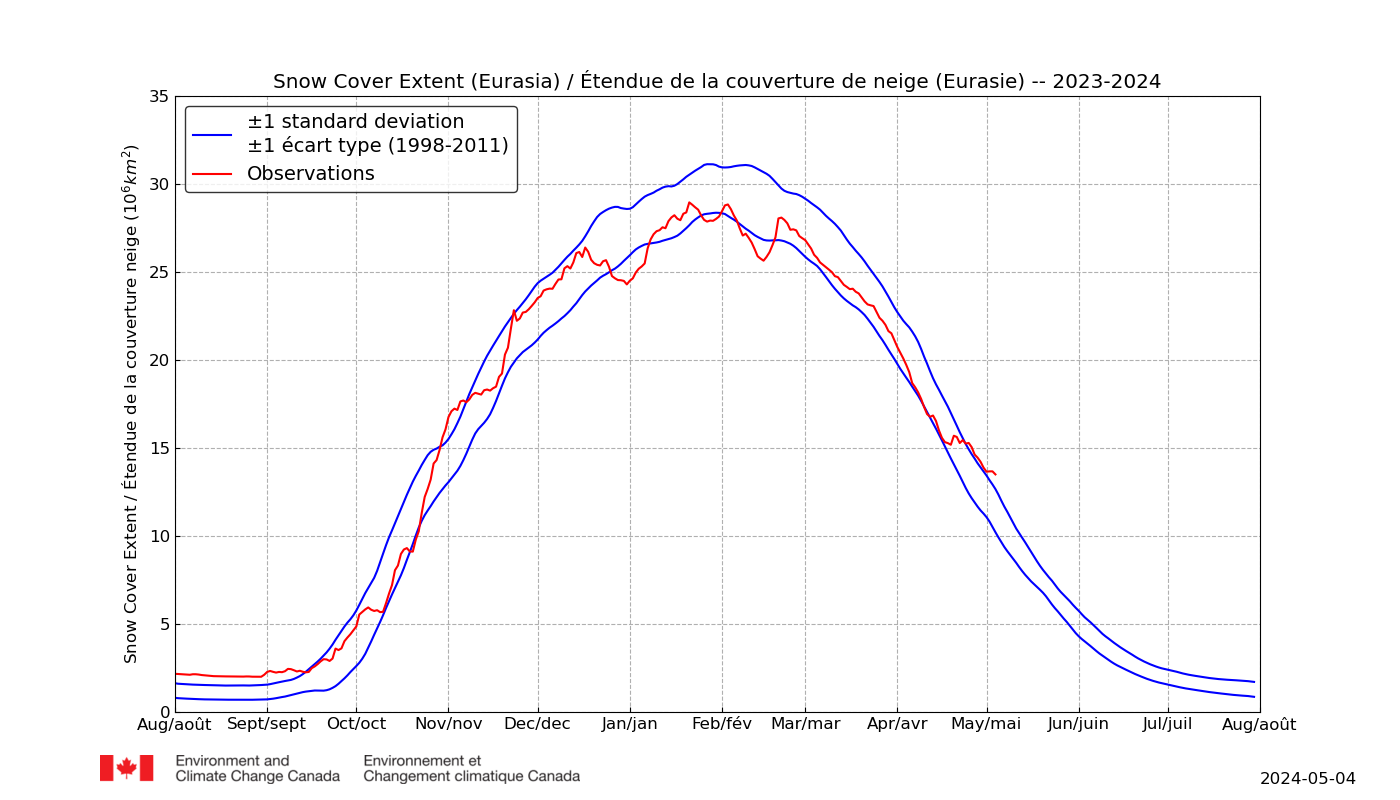 |
3c 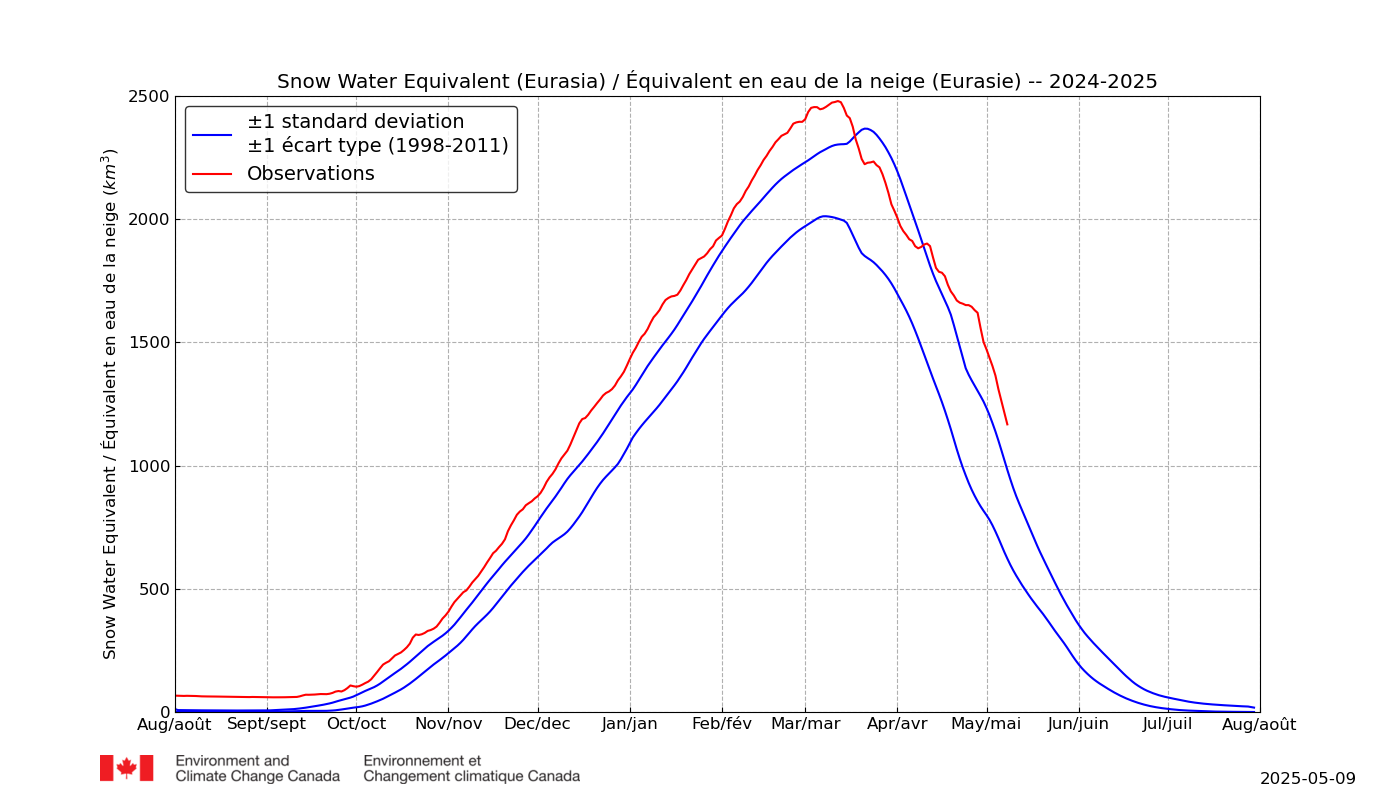 |
Figure 2: These plots show time series (updated daily) of snow cover extent (million km2) over (a) Northern Hemisphere land areas (excluding Greenland), (b) North America, and (c) Eurasia. Snow cover is assumed to be present in grid cells where the daily snow depth in the CMC analysis is at least 2 cm. The time series average and range between ±1 standard deviation (calculated for 1998/99 to 2011/12) shows how current conditions compare to historical variability.
Figure 2 légende en françaisSérie chronologique de l’étendue de la couverture de neige: Ces graphiques montrent la série chronologique (mise à jour quotidiennement) de l’étendue de la couverture de neige (en millions de km2) sur les zones terrestres de (a) l’hémisphère Nord (excluant le Groenland), (b) l'amérique du nord, et en (c) Eurasie. On estime qu’une couverture de neige est présente dans les cellules où l’épaisseur quotidienne de la neige, selon l’analyse du CMC, est d’au moins 2 cm. La moyenne de la série chronologique et l’écart type de ±1 (calculés de 1998-1999 à 2011-2012) montrent la façon dont les conditions actuelles se comparent à la variabilité historique. Une comparaison de l’étendue de la couverture de neige, provenant de l’analyse du CMC, avec d’autres ensembles de données indépendants est fournie dans Brown, R., C. Derksen et L. Wang. 2010. A multi-data set analysis of variability and change in Arctic spring snow cover extent, 1967-2008, Journal of Geophysical Research: Atmospheres 115:D16111, doi:10.1029/2010JD013975. |
Figure 3: These plots present time series (updated daily) of the current amount of water stored by the seasonal snowpack (cubic km) over (a) Northern Hemisphere land areas (excluding Greenland), (b) North America, and (c) Eurasia. Snow depth from the CMC analysis is converted to snow water equivalent using a density climatology obtained from snow survey data. The time series average and range between ±1 standard deviation (calculated for 1998/99 to 2011/12) shows how current conditions compare to historical variability.
Figure 3 légende en françaisÉquivalent en eau de la neige: Ces graphiques montrent la série chronologique (mise à jour quotidiennement) de la quantité d’eau stockée dans le manteau nival saisonnier (km3) des zones terrestres de (a) l’hémisphère Nord (excluant le Groenland), (b) l'amérique du nord, et en (c) Eurasie. L’épaisseur de la neige résultant de l’analyse du CMC est convertie en équivalent en eau au moyen d’une valeur de densité obtenue à partir des relevés nivométriques. La moyenne de la série chronologique et l’écart type de ±1 (calculés de 1998-1999 à 2011-2012) montrent la façon dont les conditions actuelles se comparent à la variabilité historique. Les détails sur les données de densité sont fournis dans Brown, R.D. and P. Mote, 2009: The response of Northern Hemisphere snow cover to a changing climate. J. Climate, 22, 2124–2145. |
A comparison of snow extent derived from the CMC analysis with other independent datasets is provided in Brown, R., C. Derksen, and L. Wang. 2010 (A multi-data set analysis of variability and change in Arctic spring snow cover extent, 1967–2008). Details on the snow density climatology are provided in Brown & Mote, 2009 (Northern Hemisphere snow cover variability and change).
Current Snow Cover and Depth over North America
Current Snow Cover

Figure 4: Stereographic projection of current snow and ice conditions in North America, updated daily, from satellite imagery of various spectral ranges, provided by NOAA.
Current Snow Depth

Figure 5: Contour map of Canada displaying snow cover depth (cm) on ground. Each contour line represents different depth measurement. Closely packed lines indicate high variability in snow depth in that region. Images updated daily, provided by the Canadian Meteorological Centre, Environment and Climate Change Canada Canada.
Current SWE vs. 30-Year Trend in Northern Hemisphere
Figure 6: The GCW/FMI SWE Tracker illustrates the current winter records for 2014/2015, relative to the long-term mean and variability of the snow water equivalent for the Northern Hemisphere (±1 standard deviation calculated for 1982-2012), excluding mountains. The historical SWE record is based on the time series of measurements by two different space-borne passive microwave sensors. The current data combines these satellite measurements with groundbased weather station records in a data assimilation scheme. Updated daily by GlobSnow, a Global Cryosphere Watch initiative, funded by the European Space Agency and coordinated by the Finnish Meteorological Institute
References
Snow Links and Data
Material on this page was provided by CMC, Environment and Climate Change Canada Canada, and the Finnish Meteorological Institute and edited by Maren Pauly and Garret Reid (Department of Geography, University of Waterloo).